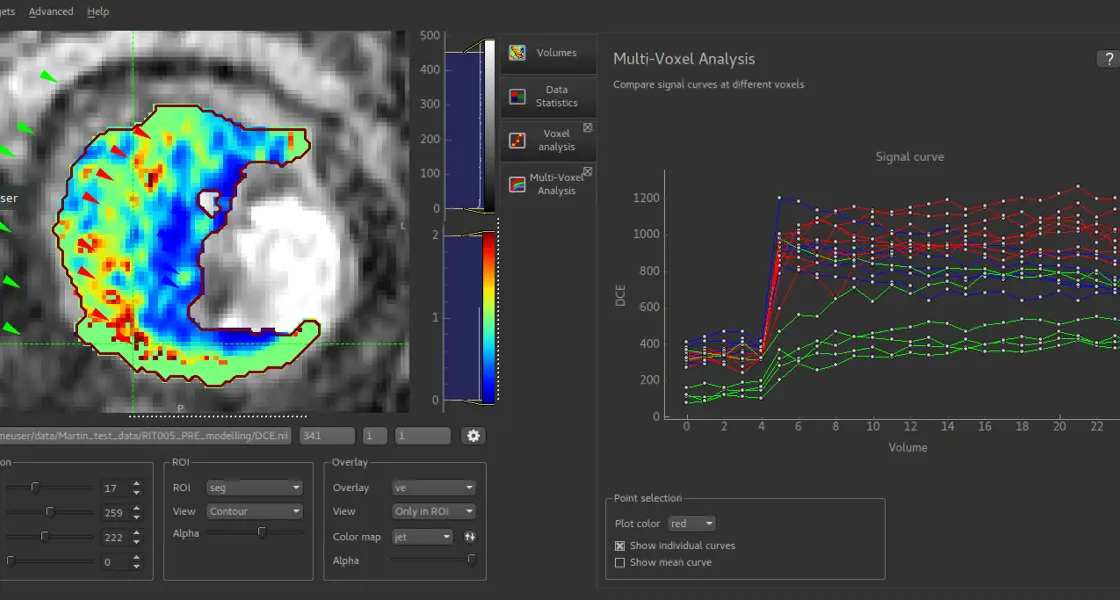
View (time-)series data from multiple voxels on the same axes
This tool allows you to view (time-)series data at multiple voxels simultaneously. Groups of voxels can be assigned different colours, and the mean can be taken over the voxels within each group.
Rigid and non-rigid registration methods
A variety of registration methods (some via extra plug-ins) are available for motion correction and other image alignment tasks.
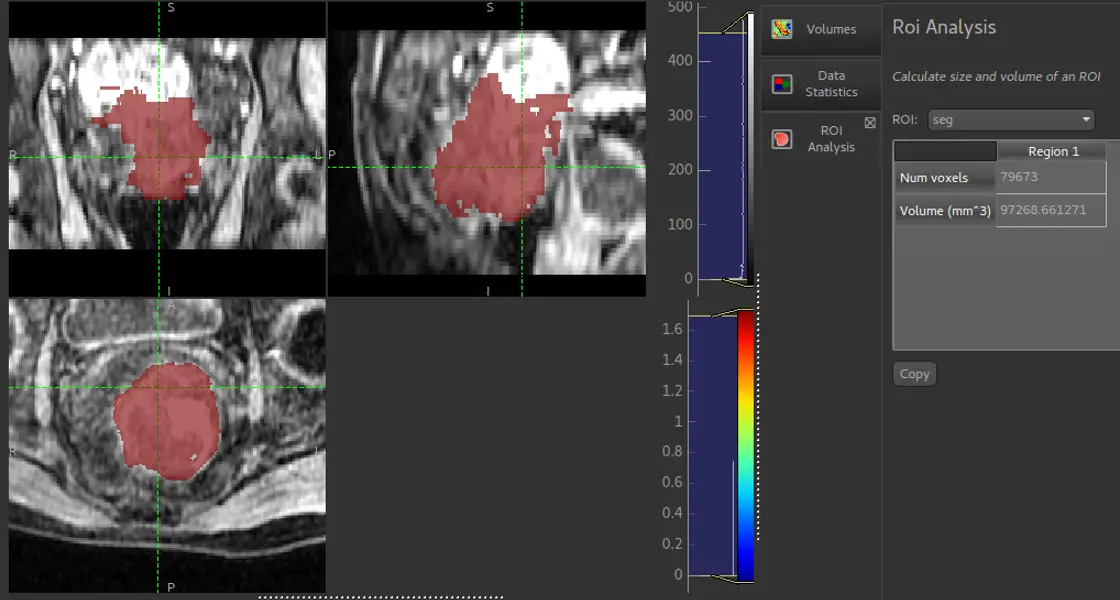
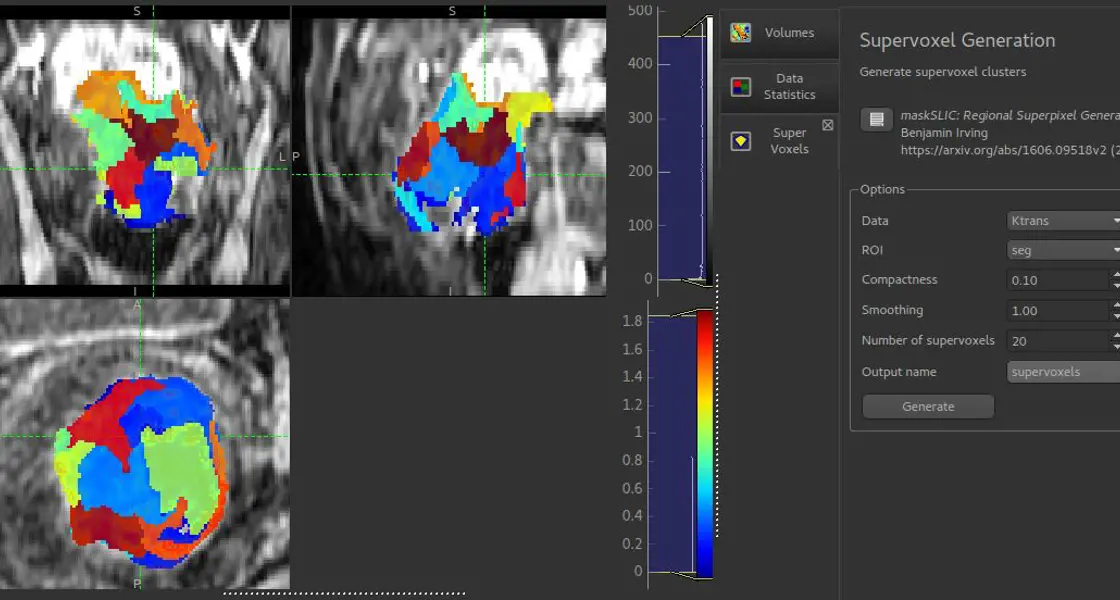
Manual ROI drawing and automated clustering methods for subregion analysis
ROI and subregion tools for:
Automatically generating data-driven subregions using supervoxels and K-means clustering.
Manually drawing ROIs on the images.
Calculating quantities and visualizing data within regions/ROIs.
Save and reuse analyses for batches of data
Quantiphyse includes a simple markup language that can be used to automate analysis so that it can be reused on the same or other data, e.g, for batch processing. Markup can be generated from the GUI from an existing analysis.